![]()
Funded by NASA
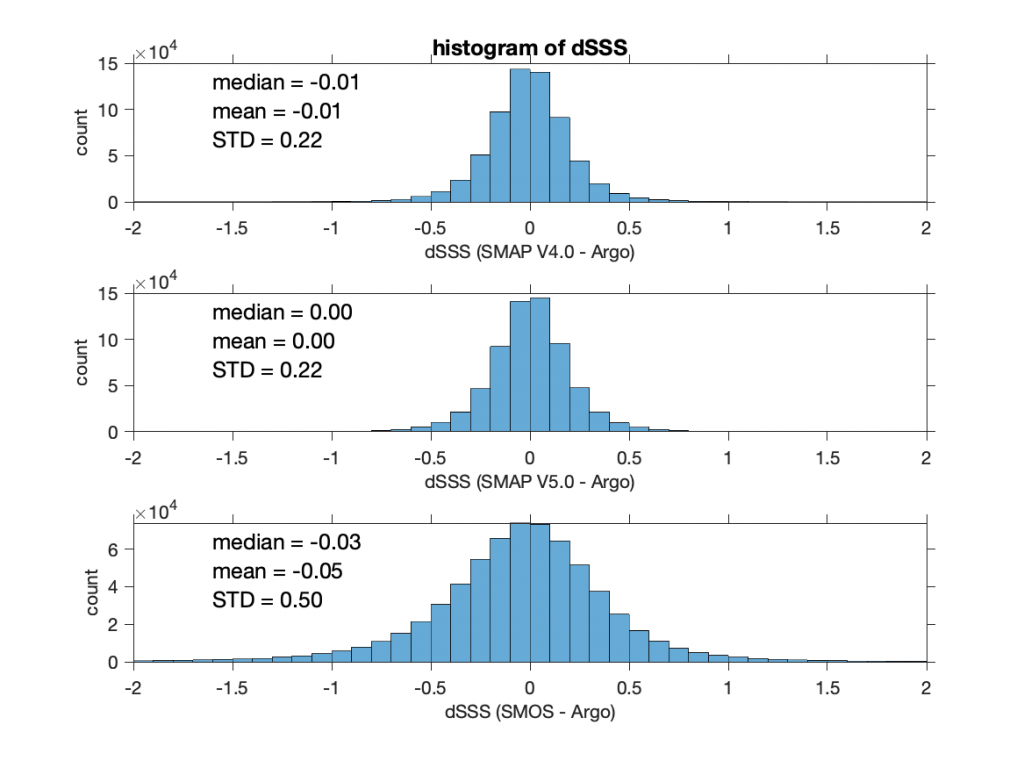
Histograms of salinity differences between Argo and SMAP/SMOS data with all flags applied are shown in Figure 6. Statistics for SMAP V4 and V5 SSS are very close because the major difference between the two versions occurs in icy areas – most observations in the open ocean are the same. There are almost no biases in the global average and the standard deviations are around 0.22 when all flags are applied to the satellite data. Statistics for SMOS show slight negative differences, meaning SMOS SSS are 0.03 psu fresher than Argo on global averages. Standard deviations of SMOS minus Argo SSS are around 0.5.