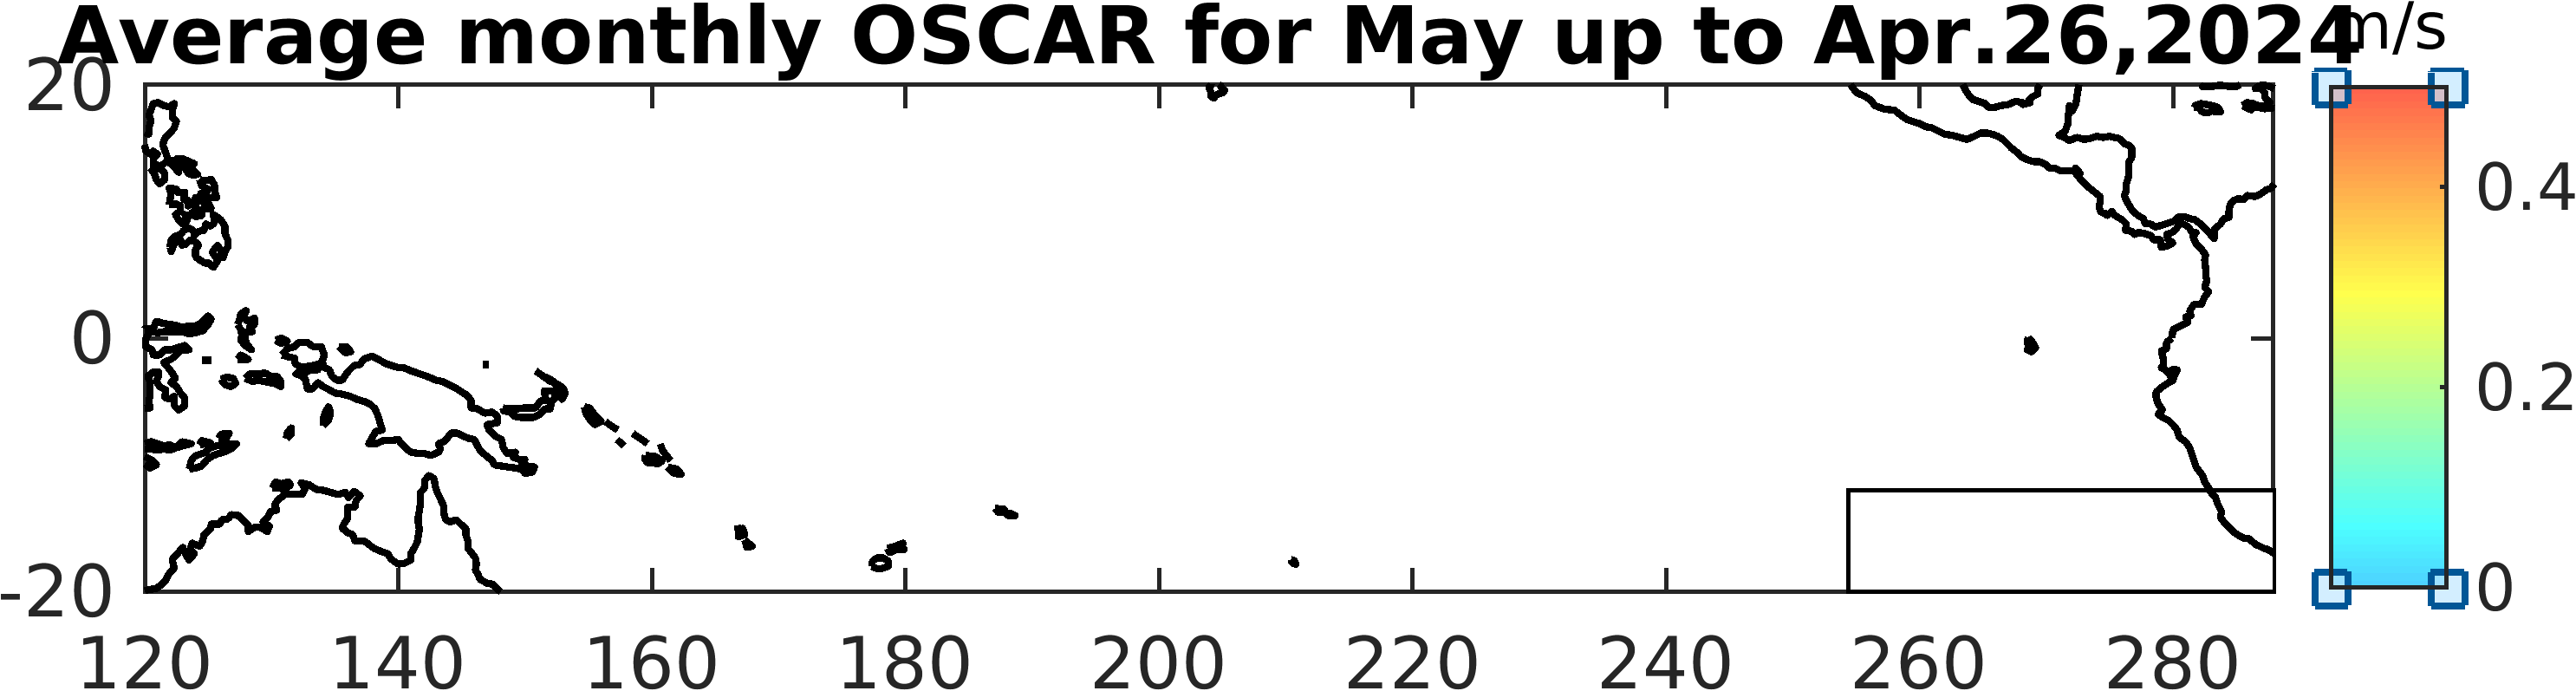
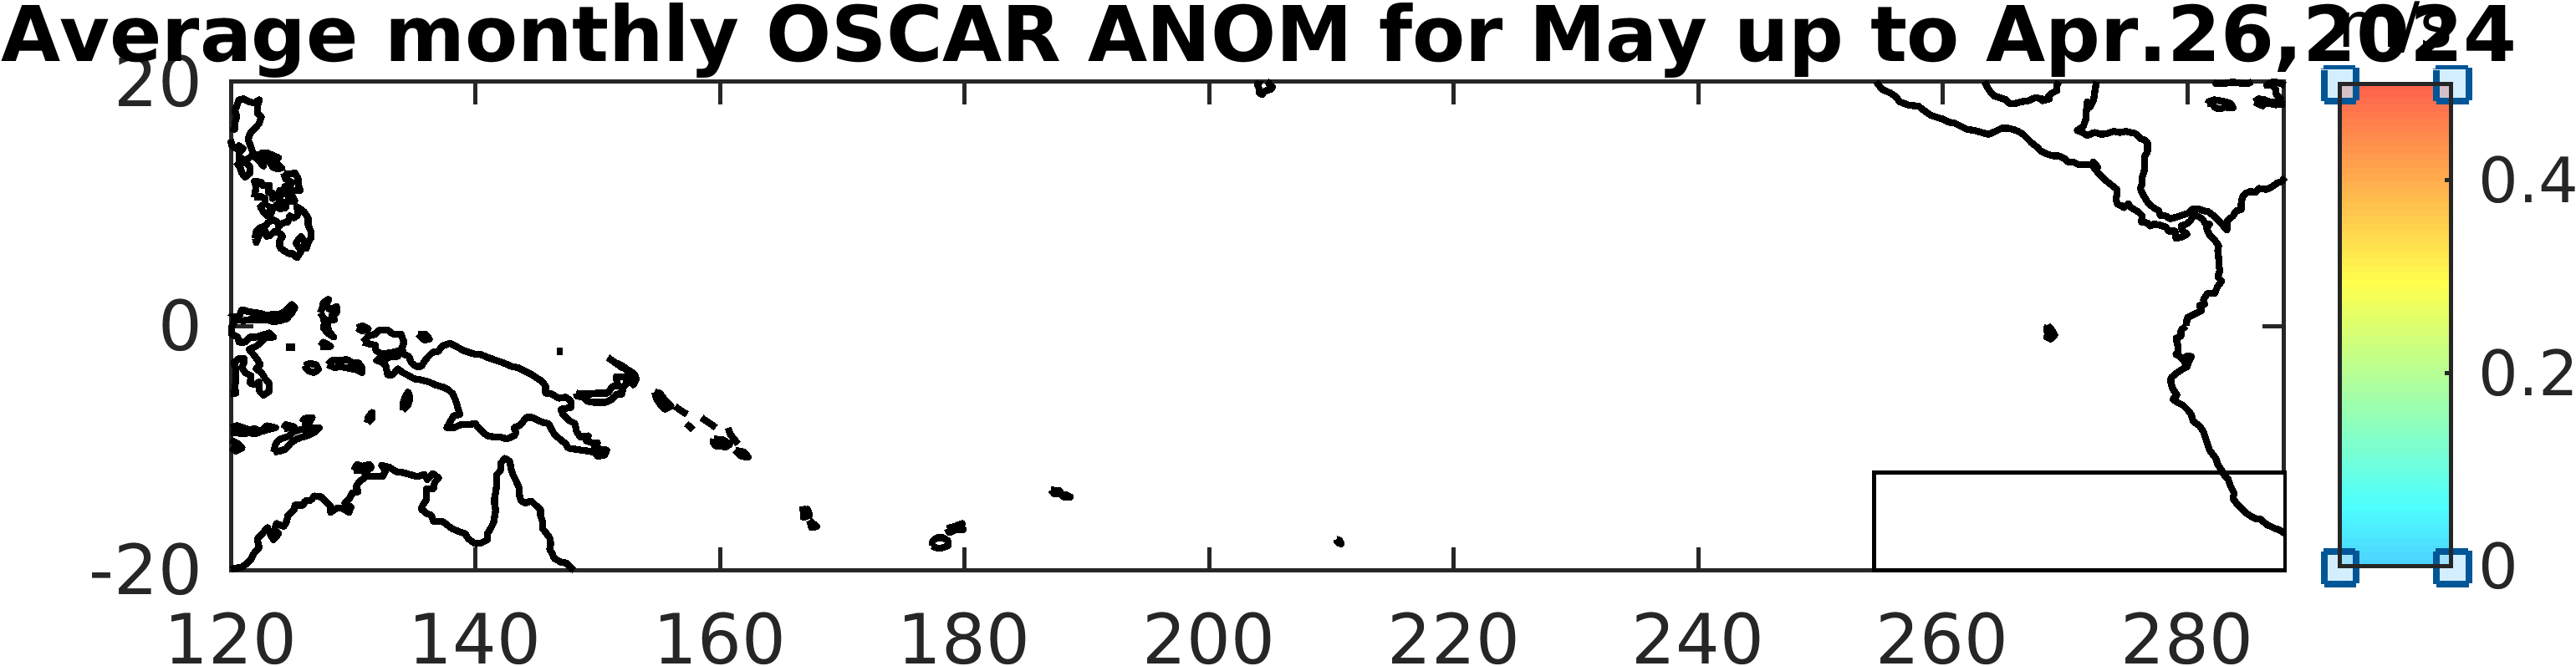
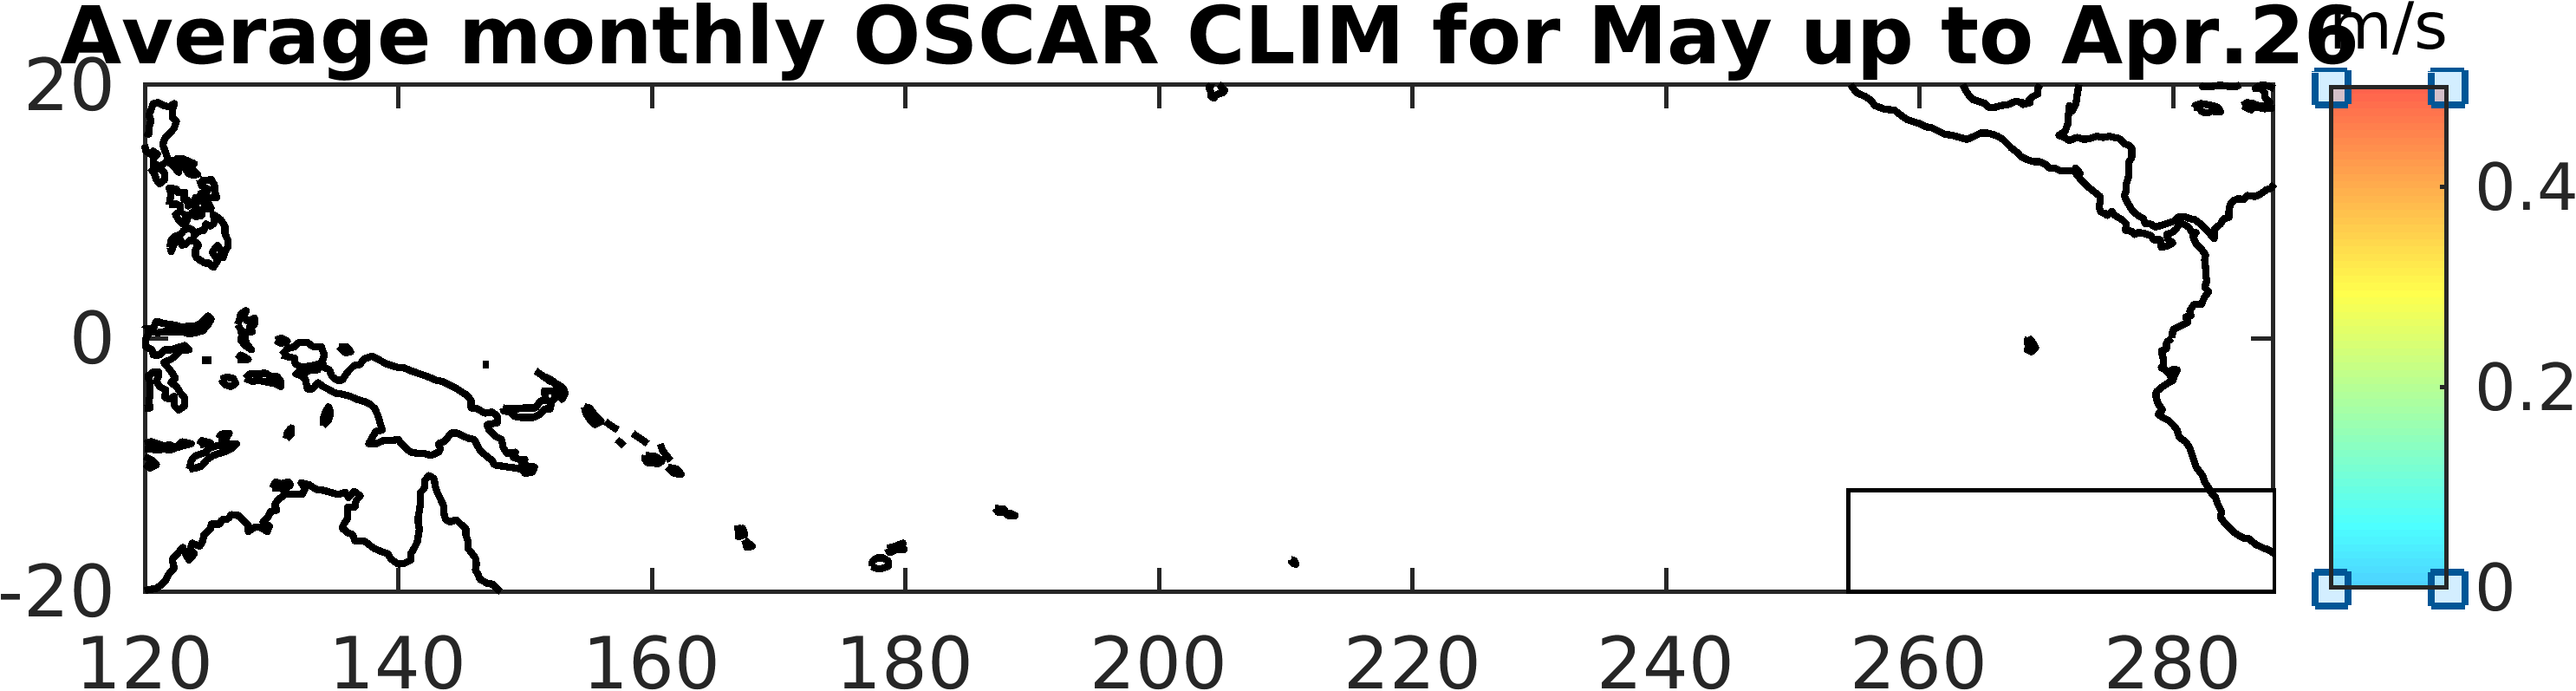
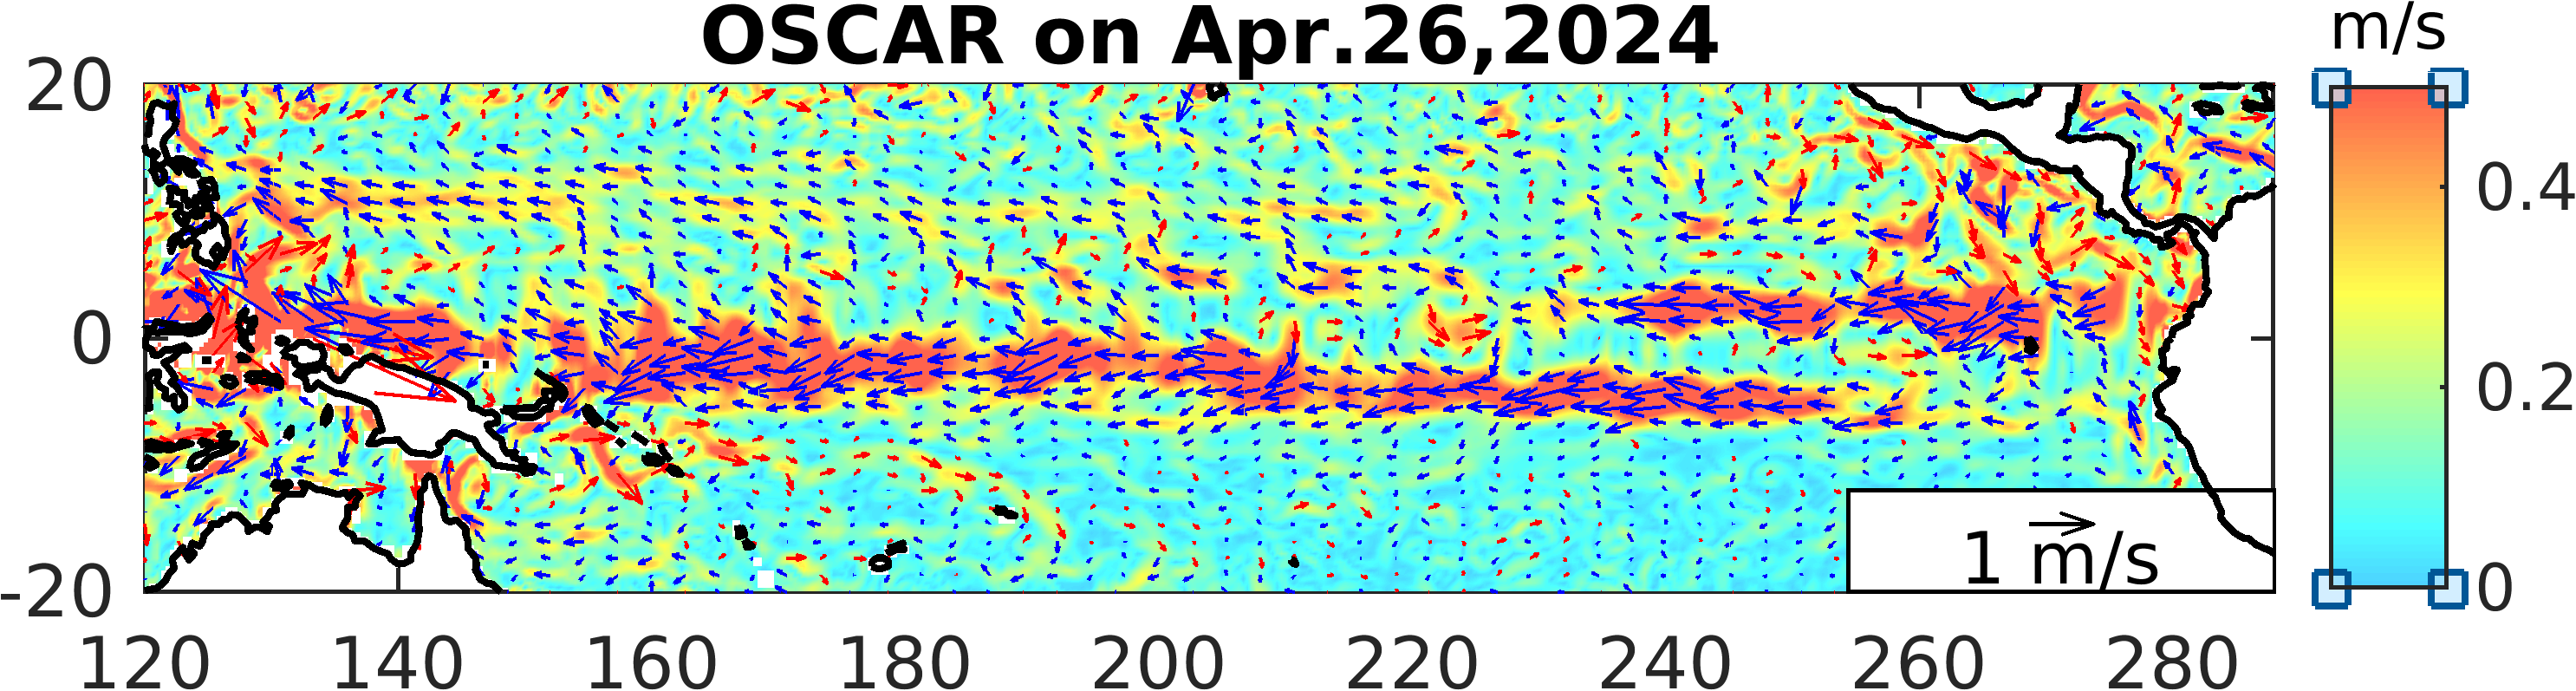
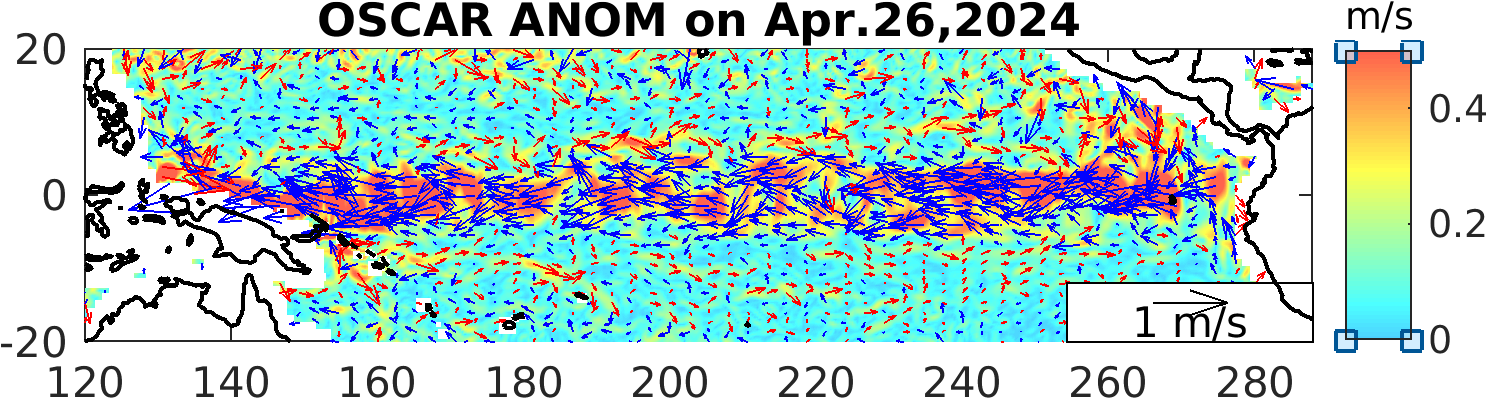
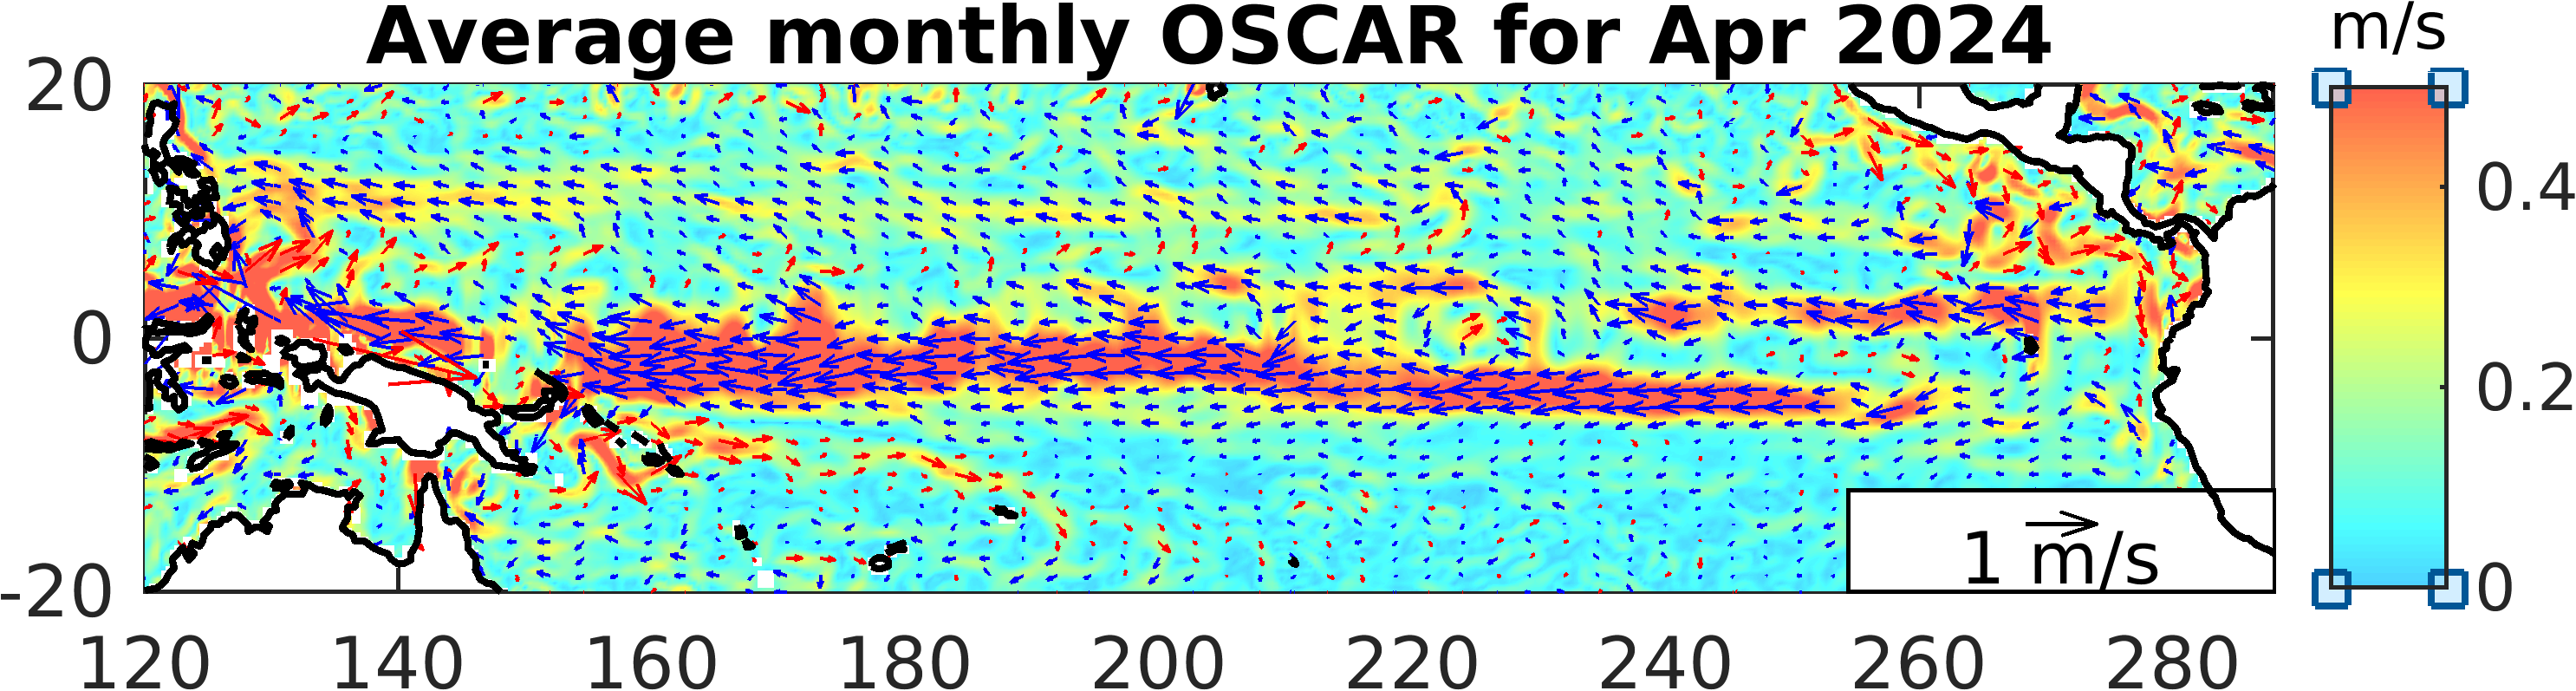
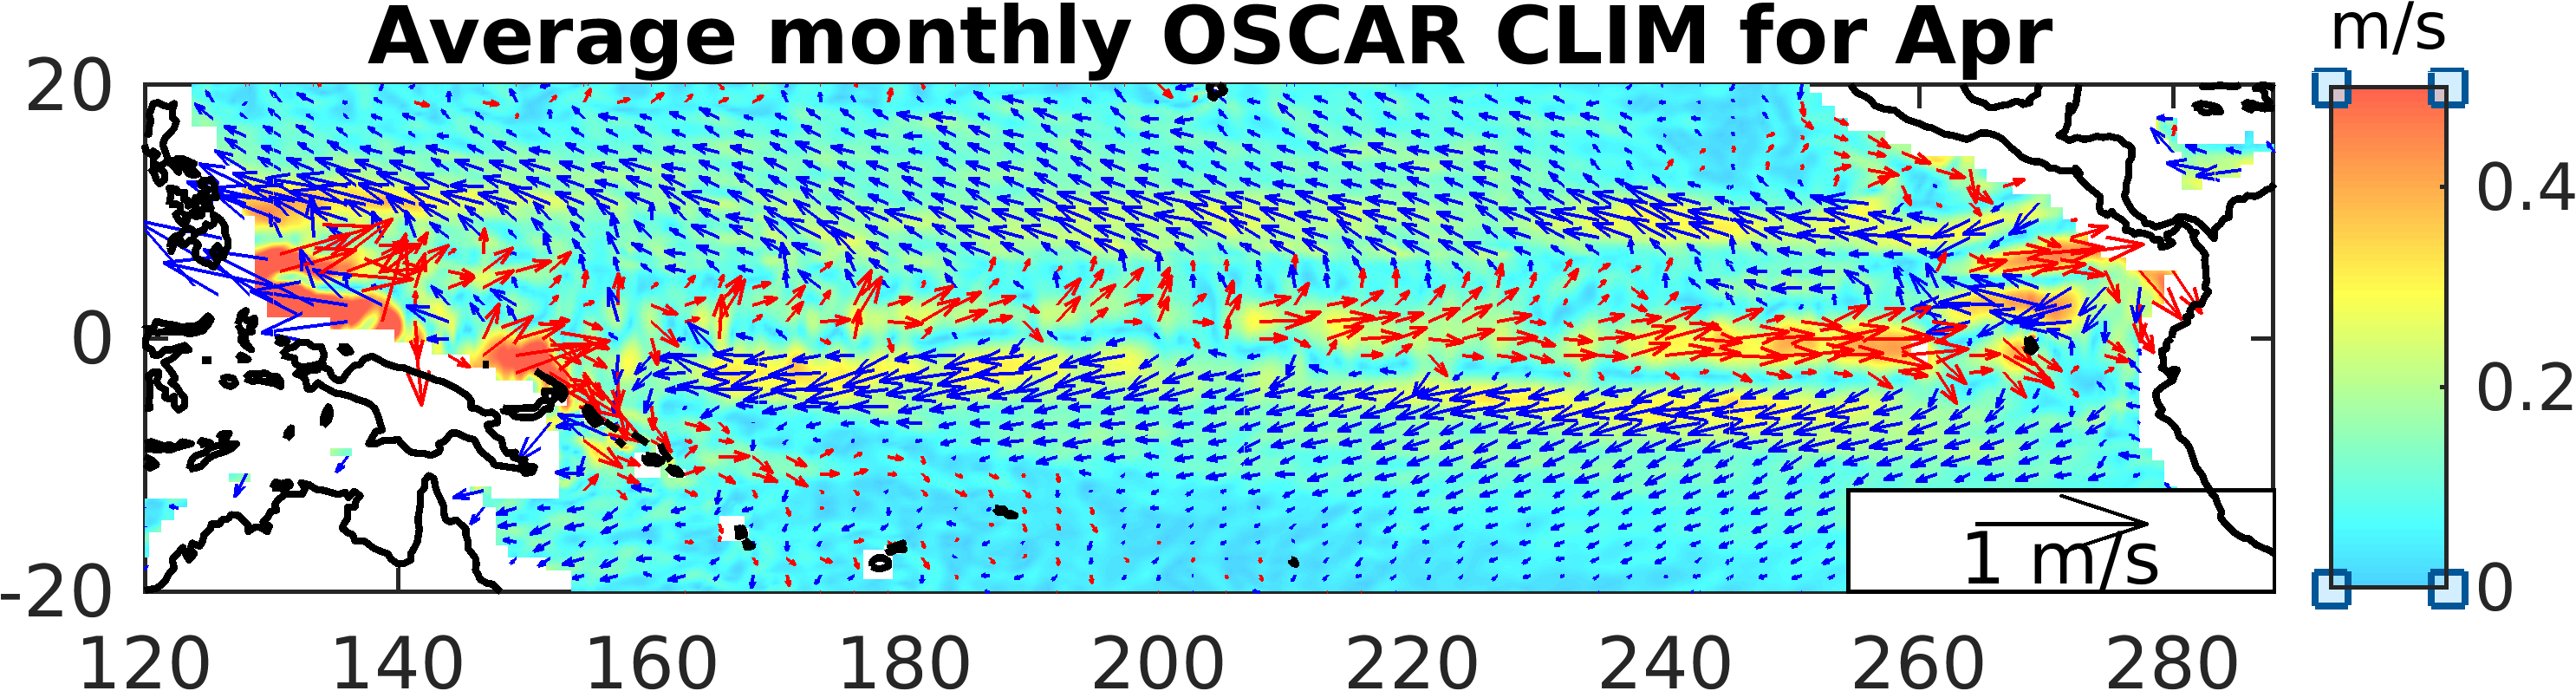
Below are plots of the conditions in the equatorial Pacific. Anomalies (ANOM) are taken from the 20 year mean from 1993 to 2012 (CLIM). Current speeds are plotted in the background of current vector arrows. Eastward currents are plotted in red, westward in blue.
Conditions this month
Latest Snapshots
Conditions Last Month
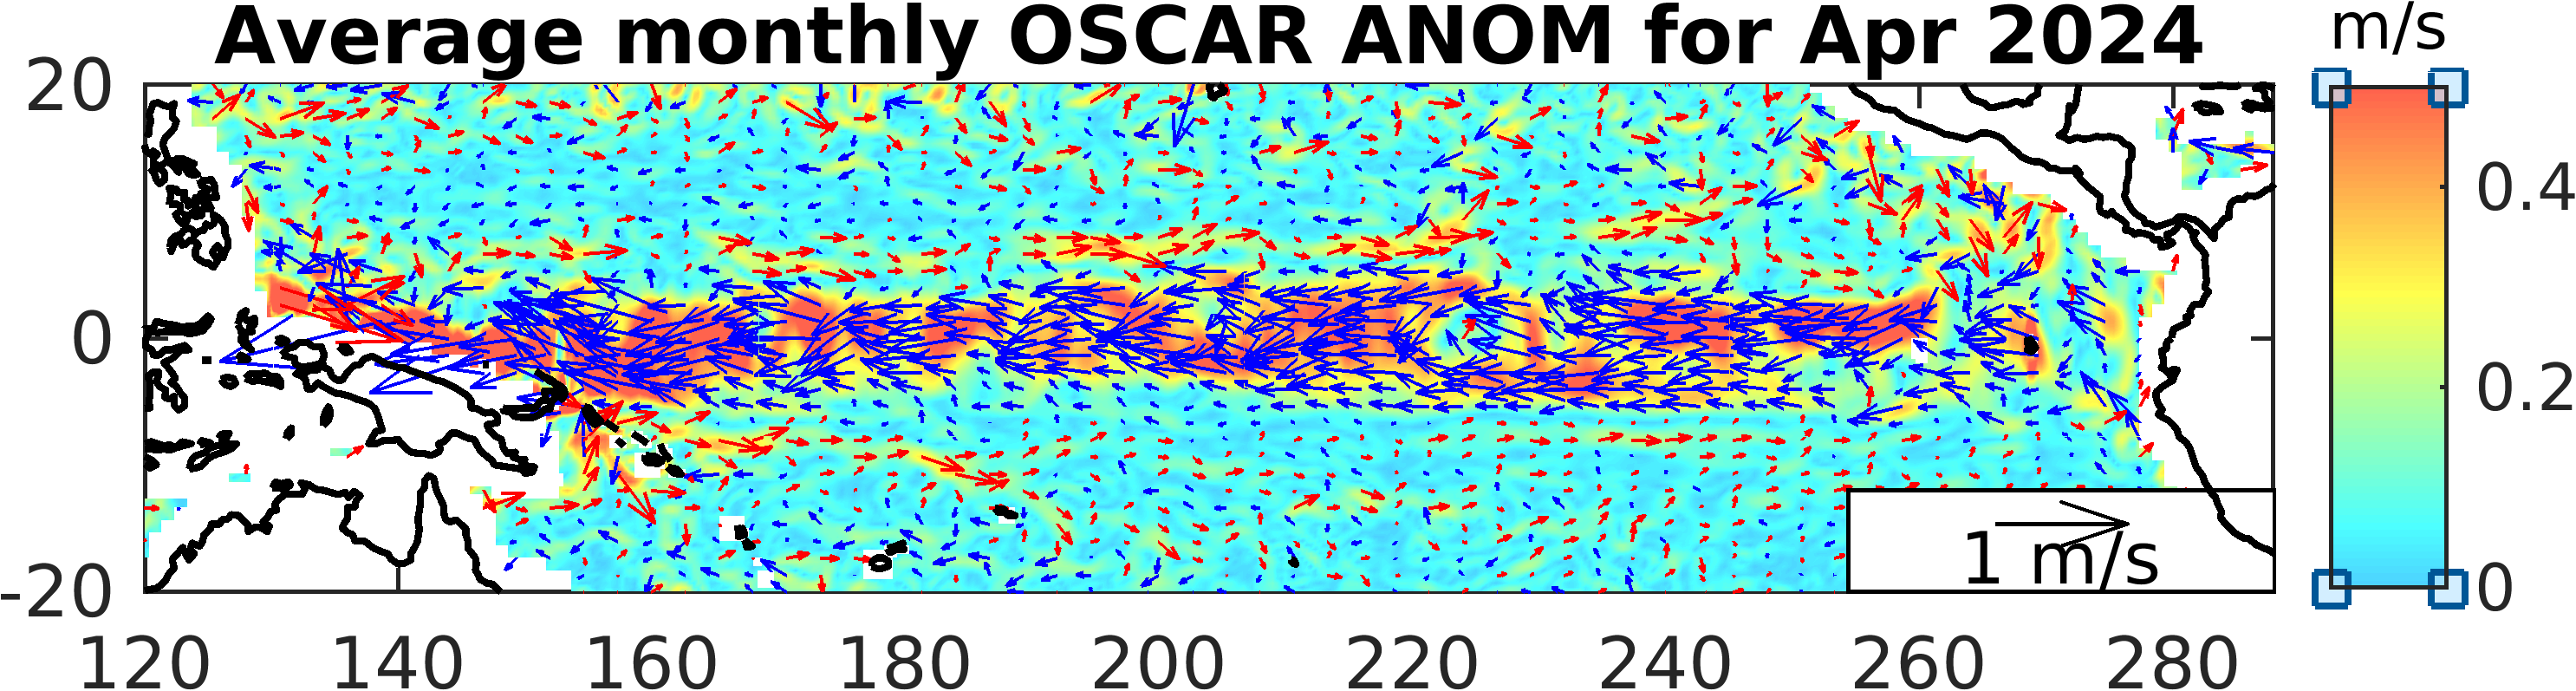
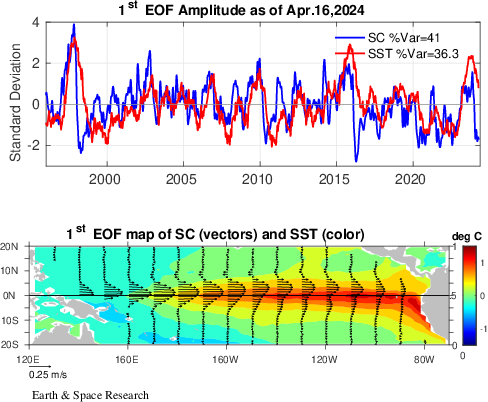
These current anomalies often lead changes in SST ENSO conditions by several months. This can been seen from the ESR surface current based ENSO index shown below and described more on our ENSO Index page.