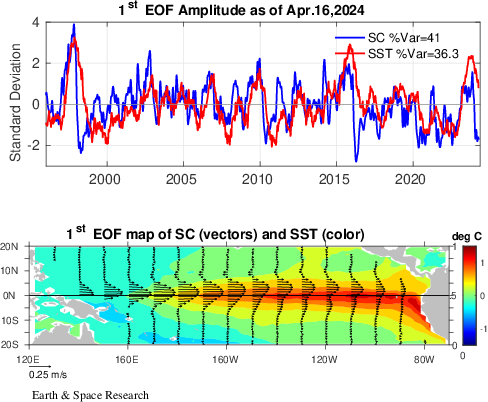
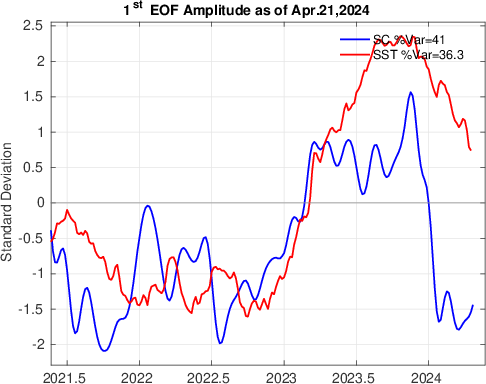
We use the near real-time surface current (SC) output from the diagnostic model to monitor the evolution of the El Niño/Southern Oscillation (ENSO) signal in the tropical Pacific Ocean. The SC anomaly variations, with the seasonal climatology removed, have a very strong ENSO signal as seen in their principal empirical orthogonal function (EOF) and its comparison with the EOF of the sea surface temperature anomaly (SST). This figure portrays the first EOF mode of SC and SST anomalies for the past decade extending through the latest 10-day period. The amplitude time series (top panel) are computed by fitting the data sets to 10-year base period eigen vectors (1993-2002) The amplitudes are then normalized by their respective standard deviations. The bottom panel shows the corresponding EOF maps, scaled accordingly. The El Niño signal can be seen as periods of positive excursions (> 1 Std. Dev.) of the amplitude time series.


