
Before the ESR program, glaciers had never crossed my mind, much less had I imagined I would spend a whole summer studying them. This program showed me just how fascinating they could be and just how many interesting processes they are affected by. Using data science helped me discover how powerful data can be in understanding the earth systems, even in remote places like Antarctica.
Through this project, I greatly expanded my knowledge of how velocity affects elevation and how glacier systems work, specifically in Jutulsessen. Working with satellite datasets forced me to think critically about what the numbers actually mean, what their limitations are, and allowed me to apply data science to the real world.
Being mentored by Dr. Black and Dr. Town was the most valuable part of the experience. They guided me through the technical aspects, like using xarray, understanding geospatial grids, and also how to ask meaningful scientific questions and extract meaningful parts of datasets. I learned that even when patterns aren’t strong or results are uncertain, the work still matters. It helps build the foundation for better tools, clearer questions, and future researchers.
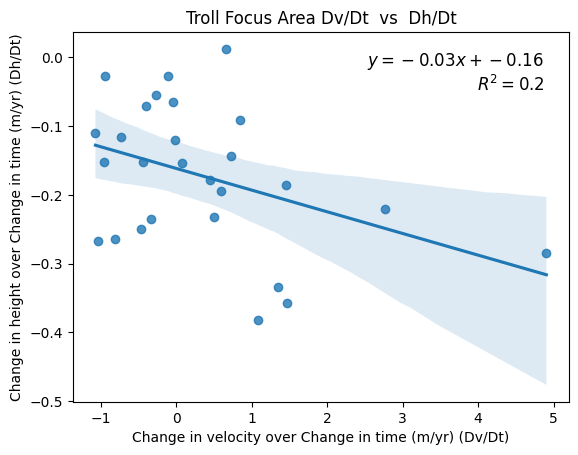
For my results, the scatterplot shows a weak negative correlation between Dh/dt and Dv/Dt in the Troll Focus Area. This suggests that faster ice flow may be loosely associated with greater thinning, which is consistent with known patterns of dynamic thinning. However, because the datasets only overlapped for a single year, it’s unreasonable to make strong generalizations. Short-term variations, noise in the data, and time scale mismatches could all influence this trend. Despite this, the result shows the potential of using velocity as a way to cross-check elevation measurements, and to highlight areas where ice might be stretching, accelerating, or responding to shifts in mass balance. It allows for deeper analysis as more years of data become available.
While my analysis did not show the most clear result, the most important takeaway wasn’t the result itself, but the process of learning how to handle, clean, and interpret this kind of gridded and time series data. Additionally, I helped set up future researchers for analyzing this topic in further detail.
Find out more of my work by viewing my poster:
Relationship Between Velocity Changes and Height Changes in Area around Troll Station