
Ice and Data: A Summer Exploring Troll Station
This summer at the Earth Science Research Institute, I dove into the critical work of understanding Antarctica’s changing ice. My project focused on the complex landscape around Troll Research Station, where I sought to answer a fundamental question: How well do our climate models, which predict changes on the ice, stack up against direct measurements from NASA’s advanced ICESat-2 satellite? Getting this right is crucial, as these models are key to forecasting how our planet’s ice sheets will respond to a warming climate and impact future sea level rise.
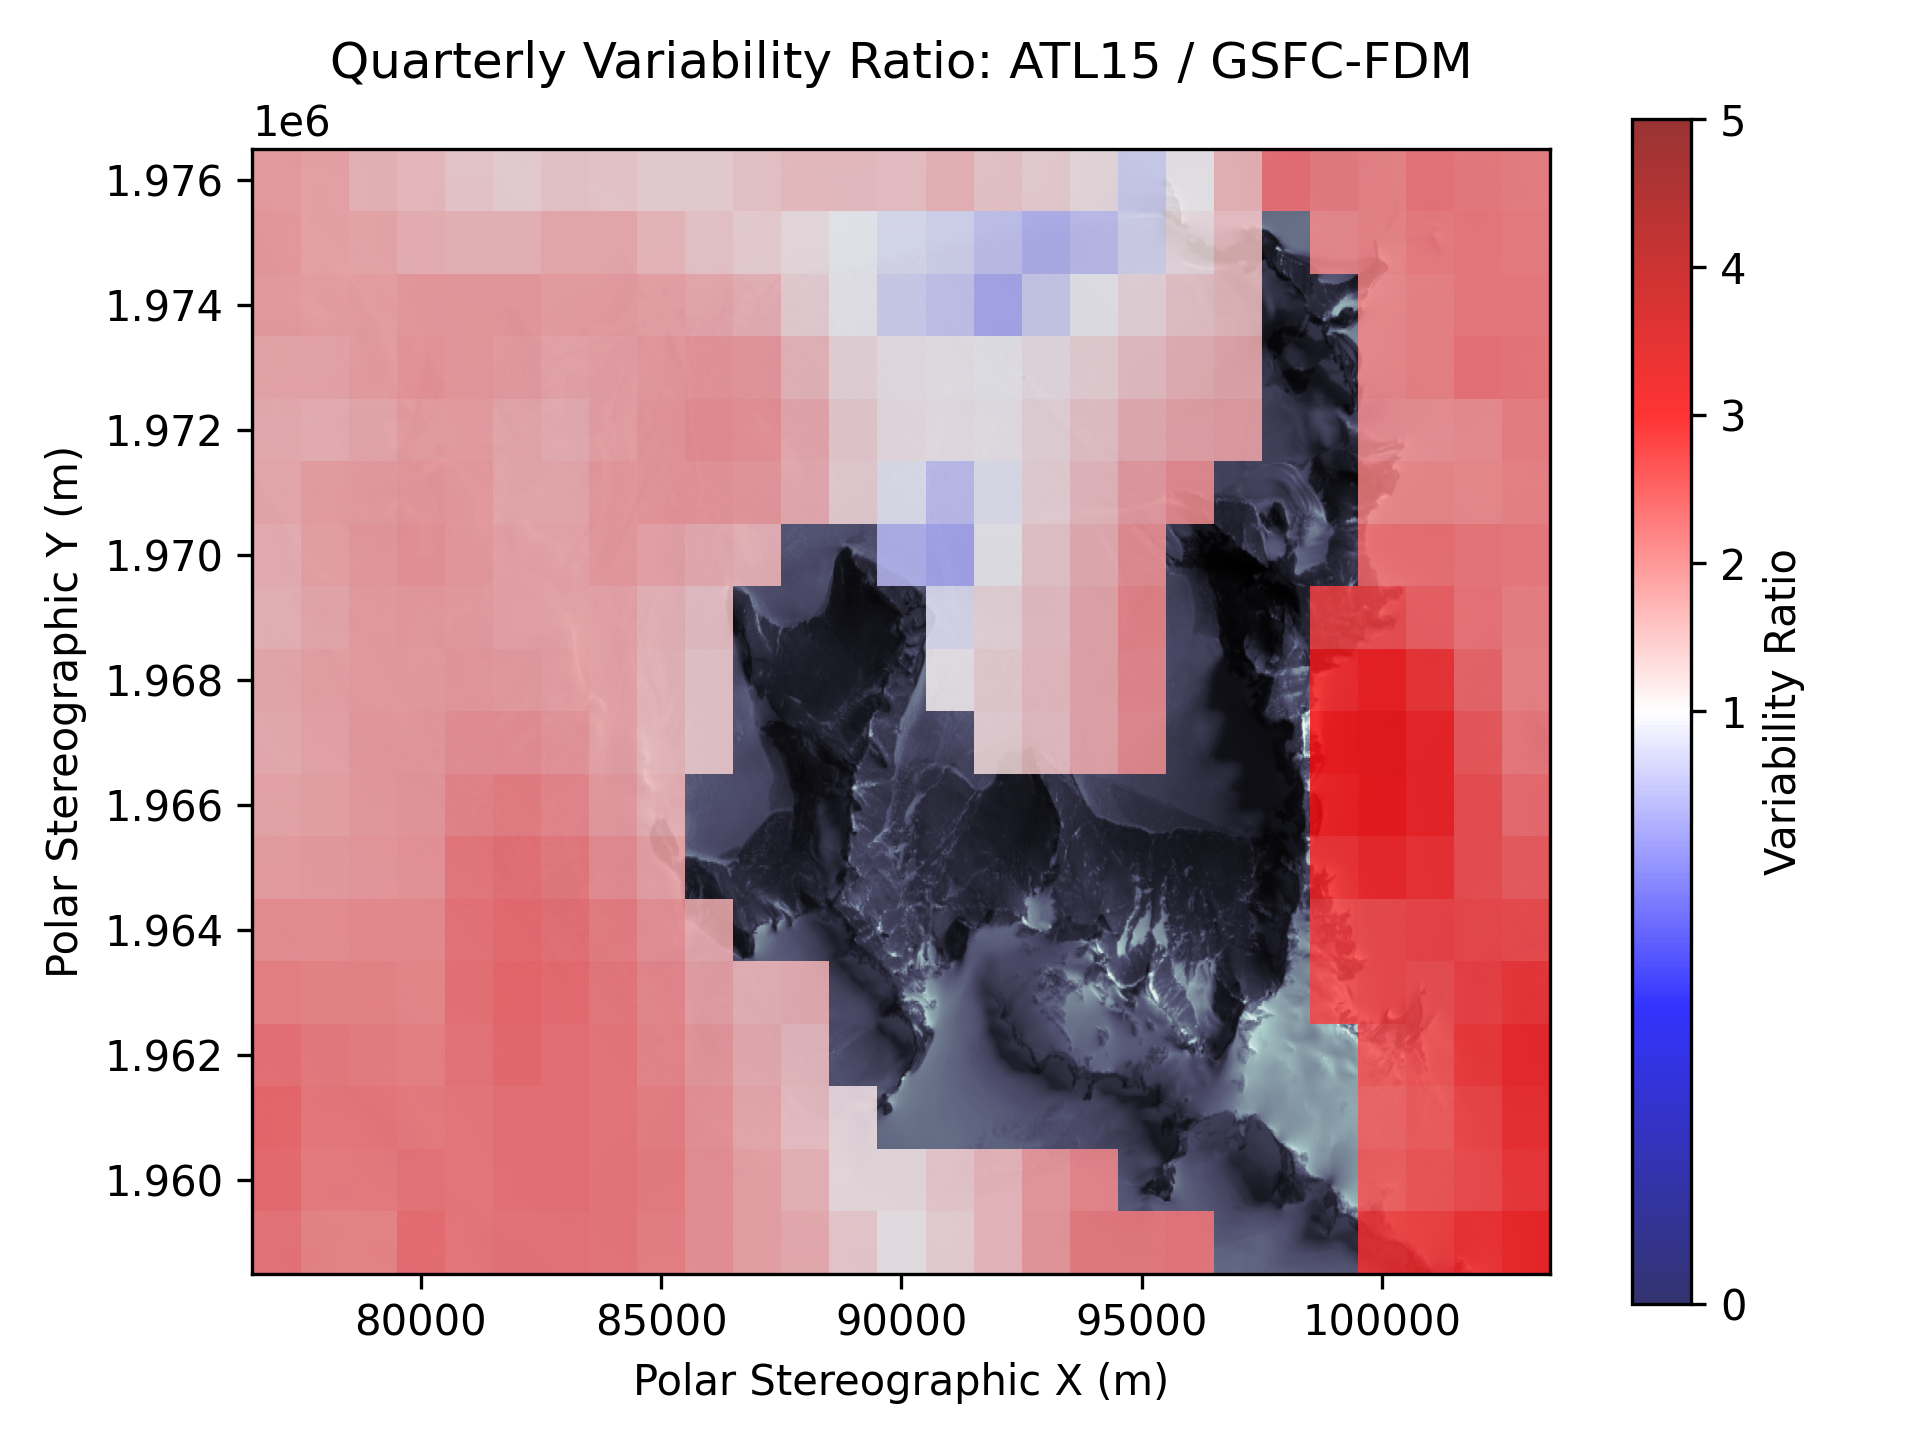
The ICESat-2 satellite uses a laser to measure the height of Antarctic ice, in contrast, the climate model I worked with (GSFC-FDM) estimates the surface height using data on snow accumulation and compaction.
Under the guidance of Dr. Taryn Black and Dr. Michael Town, I learned how to analyze the height measurement data with python tools such as matplotlib and xarray, libraries that previously I had no experience with. Their knowledge helped us create our own path, and, despite our endless stream of questions, they answered them all. Although, those answers only led to more questions about the mysteries of Antarctica. My peers and I also had the to talk with experienced polar scientists, lending us a unique perspective on how their work furthers Antarctic research.
The investigation revealed a fascinating difference between the two perspectives. While the satellite and the model often agreed on the overall, big-picture changes in ice levels, the satellite provided a much more detailed and rugged view. It captured the complex, fine-scale bumps and dips of the mountainous terrain. These details are often averaged out by the smoother, more generalized climate model. This discovery highlights that our powerful models might be missing important, localized processes happening on the ice surface.
In this (albeit confusing) graph, you can see that the variability, is much higher in the ICESat-2 data. Variability in this sense meaning how much the height fluctuates over time. In the deeper reds, the variability of the ICESat-2 data can reach up to 5 times what the model predicts!
The culmination of my research was presenting these findings on a scientific poster to polar experts and students at the University of Washington. It was an incredible opportunity to share my work and learn from seasoned scientists. In addition, it gave me more confidence explaining my own research, teaching me that explaining why the work matters is just as important as the work itself. This experience drove home the importance of communication in science; having data is one thing, but being able to clearly share its story and significance is what allows it to have a real impact.
Find out more of my work by viewing my poster:
Firn Model vs ICESat-2 Height Data Comparison