Intro

A study of the long period baroclinic variability in the Northeast Pacific Ocean (Cummings and Lagerloef, 2004) concluded that this variability occurs as a response to stochastic atmospheric forcing. They report that a significant percentage (~40%) of this variability is evident in the first EOF mode (EOF1) of a Markov model driven by local Ekman pumping as well as the EOF1 mode of the Topex/Poseiden/Jason Altimeter representing the SSH. This indicates that the EOF1 of the altimeter data is a useful indicator of the decadal variability in the northeast Pacific. Because SSH variability represents the vertically integrated buoyancy changes of the upper ocean and pycnocline, it provides more slowly varying and robust signal than SST, which responds more rapidly to atmospheric forcing. This is consistent with previous studies of dynamic height anomalies over the Gulf of Alaska (Lagerloef, 1995), spectra of sea surface temperature and salinity (Hall and Manabe, 1997), and a long time series of pycnocline depth anomalies at Station P (Cummings and Lagerloef, 2002).

PDO index

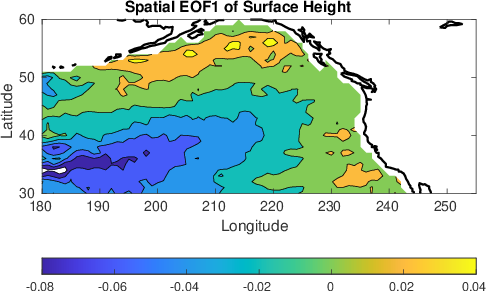
As a method of monitoring this variability, we present the EOF1 amplitude and spatial pattern of the altimeter SSH anomaly (from the long-term mean seasonal cycle). Other North Pacific variability indices are shown for comparison:

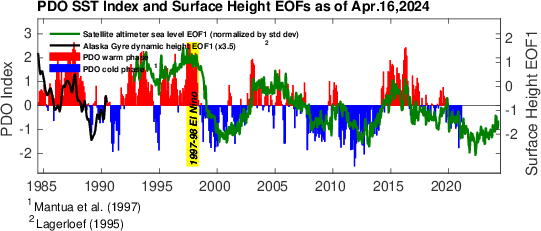
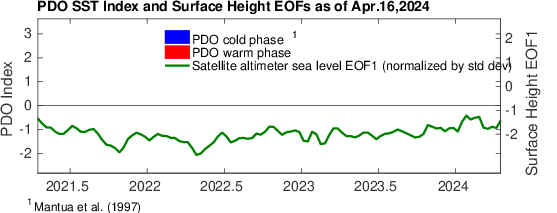
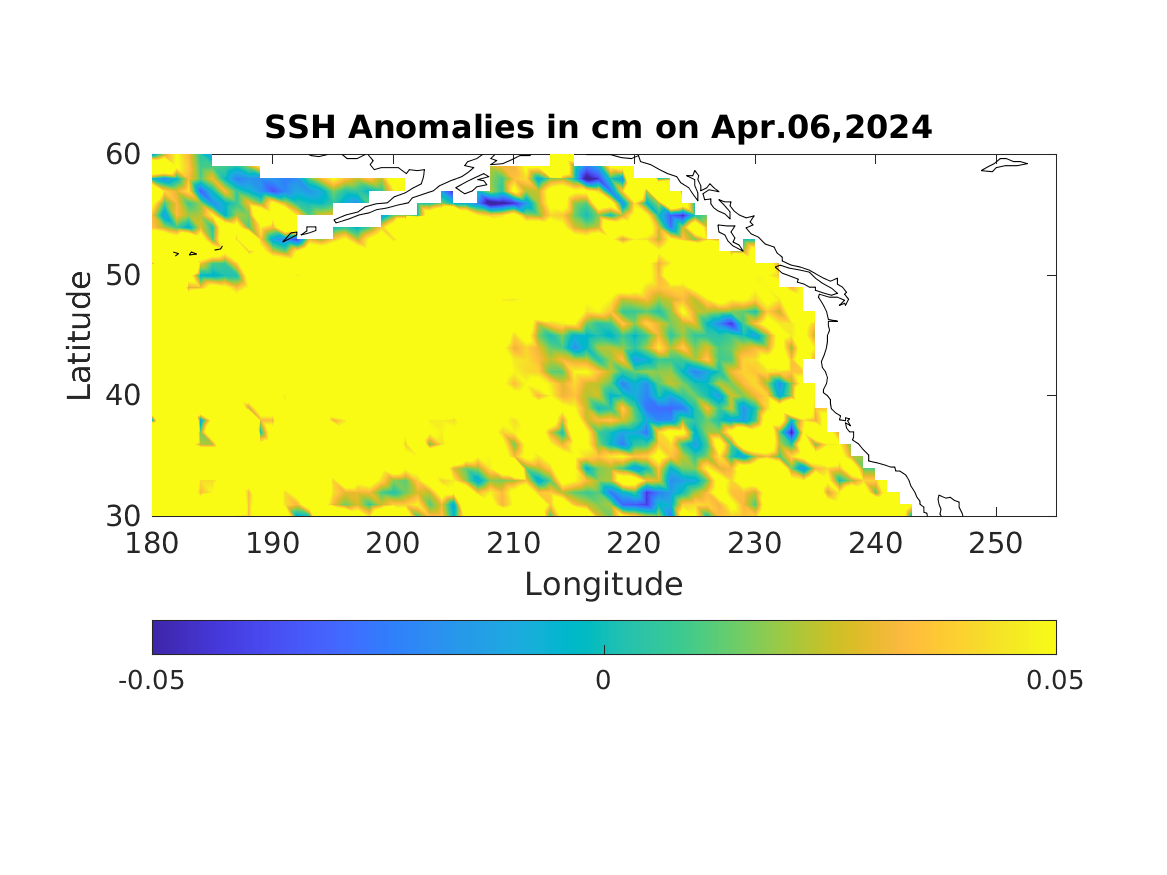
(1) The PDO SST index (Mantua, 1997, is portrayed as blue and red bars, and

(2) the historic (1968-1990) Alaska Gyre dynamic height anomaly EOF1 (Lagerloef, 1995), scaled with a factor of 3.5, is the black line.

The normalized altimeter SSH anomaly EOF1 amplitude is included as the green line. The most recent SSH anomalies from the 1993:2007 climatology are also shown.

Data and Processing Info

The SSH data source is the AVISO multi-satellite data product  (www.aviso.oceanobs.com).  The EOF amplitude time series is computed by fitting the data set to 15-year base period eigen vectors (1993-2007). The EOF1 amplitude is then normalized by its standard deviation.

A text file of the normalized EOF1 amplitude (green line) is available here (historical) and with sign convention fixed to match plot here.

The AVISO altimeter products were produced by Ssalto/Duacs and distributed by Aviso, with support from Cnes.

Note: The gridded SSH data used in this analysis has recently changed. Previously we used a gridded SSH product derived exclusively from the Topex/Poseiden/Jason altimeters. Beginning in 2009, the data presented here are based on the AVISO data product, which analyses multiple altimeters and offers higher spatial resolution than the previous analysis.  Consequently, the newly derived EOF1 spatial pattern shows more structure than the previous analysis.  The 15-year correlation coefficient between the respective SSH EOF1 time series is 0.97.

References

Cummins, P. , Lagerloef, G.S.E., and G. Mitchum, 2005. A regional index of northeast Pacific variability based on satellite altimeter data, Geophys. Res. Lett., 32, L17607, doi:10.1029/2005GL023642.

Cummins, P. and G. Lagerloef, 2004. Wind-driven interannual variability over the Northeast Pacific Ocean, Deep Sea Res. I, 51, 2105-2121.

Cummins, P. and G.S.E. Lagerloef, 2002. Low frequency pycnocline depth variability at Station P in the northeast Pacific, J. Phys. Oceanogr., 32, 3207-3215.

Hall, A., and S. Manabe, 1997. Can local linear stochastic theory explain sea surface temperature and salinity variability? Climate Dynamics, 13(3), 167-180.

Lagerloef, G., 1995. Interdecadal variations in the Alaska Gyre, J. Phys. Oceanogr., 25, 2242- 2258.

Mantua, N.J., S.R. Hare, Y. Zhang, J.M. Wallace, and R.C. Francis, 1997. A Pacific decadal climate oscillation with impacts on salmon. Bulletin of the American Meteorological Society, Vol. 78, pp 1069-1079.