![]()
Funded by NASA
At the moment, there are no direct tools to plot OSCAR v2.0. A large advantage to hosting data in the cloud will be data analysis and visualization without the need to download entire datasets. Techniques and recipes will be shared on the main PO.DAAC pages, such as https://podaac.jpl.nasa.gov/cloud-datasets/resources, as well as specific OSCAR recipes on the forum.
Meanwhile, OSCAR third degree data can be subsetted and plotted using tools on the PO.DAAC site and has been used for visualizations and as part of educational websites.
The Asia-Pacific Data-Research Center (APDRC) of the International Pacific Research Center (IPRC) does have OSCAR retrieved from PO.DAAC on their LAS server/plotter: OSCAR at APDRC. Click on the small blue LAS button to plot.
NASA Physical Oceanography Data Center, the PO.DAAC
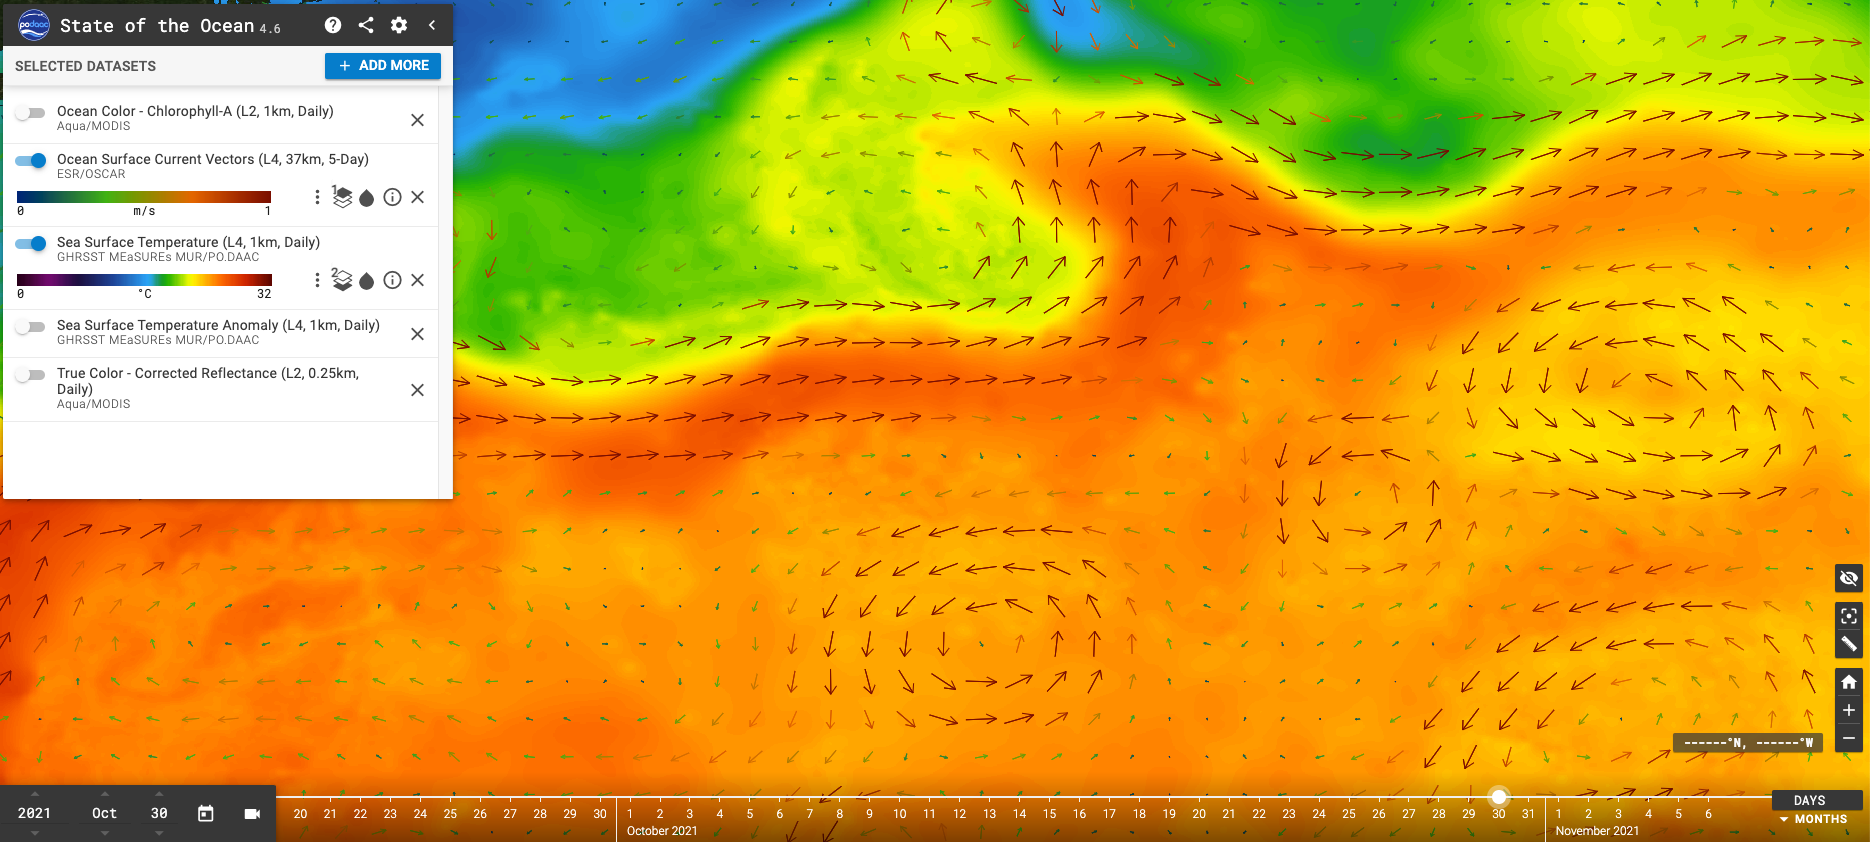
OSCAR 1/3 degree can be plotted on the PO.DAAC “State of the Ocean” (SOTO): OSCAR on SOTO. Click on “Satellite Layers” in the upper left to get plotting options. OSCAR can be overlaid on other datasets to get the latest “State of the Ocean” view of conditions. A sample PO.DAAC SOTO plot for SST in color and OSCAR vector arrows for Gulf Stream eddies on Oct 30, 2021 is shown below.
PO.DAAC also has subsetting capabilities through their Live Access Server (LAS): OSCAR through PO.DAAC LAS. Plotting and some time series analysis can also be done with this tool.
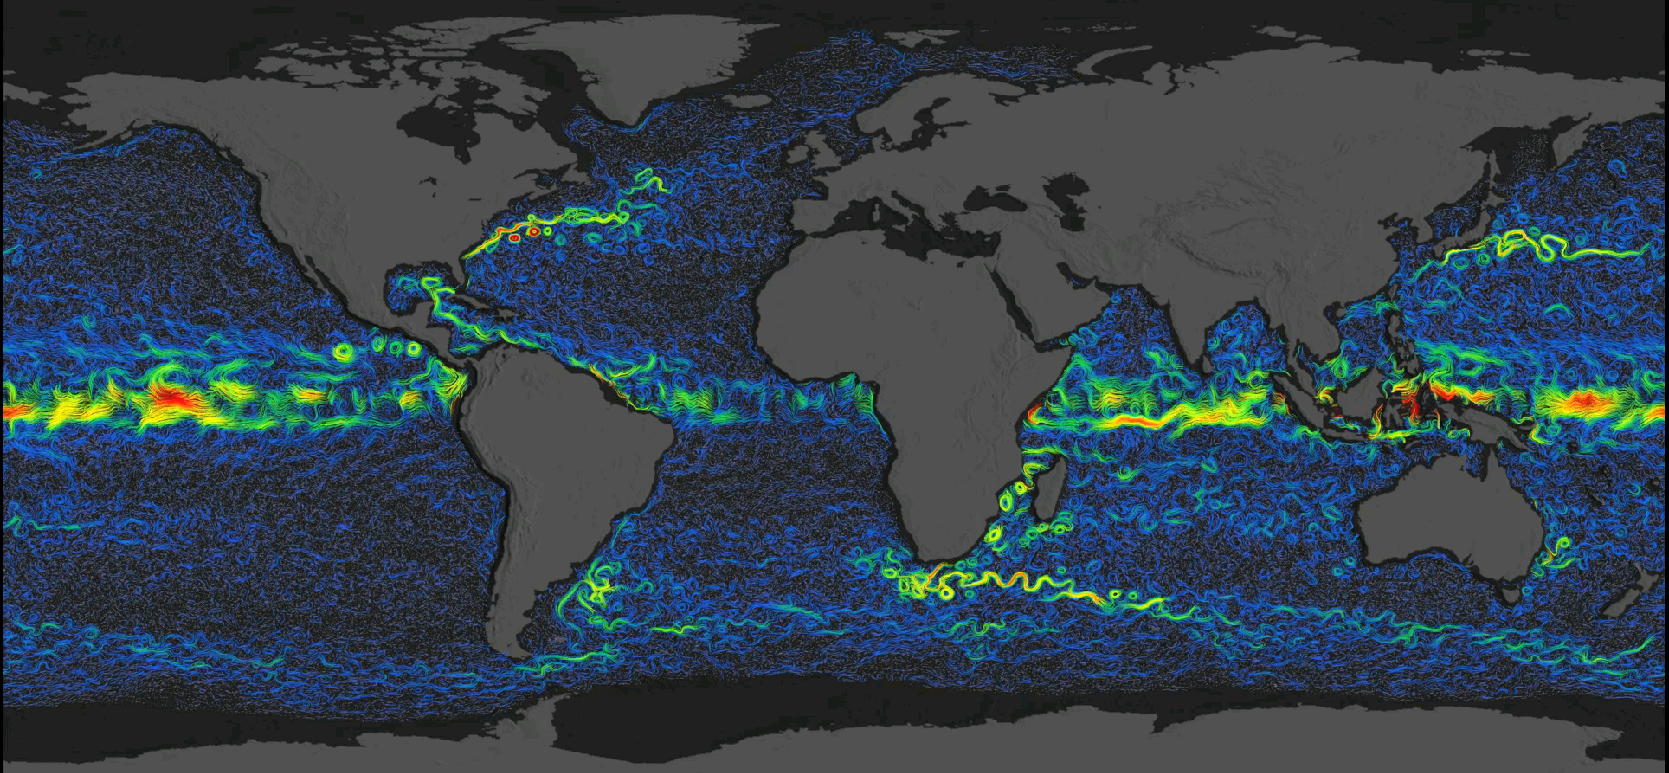
NASA Goddard Scientific Visualization Studio
High resolution movies of particles following the flow using OSCAR data have been created by Greg Shirah at the NASA Goddard Scientific Visualization Studio, https://svs.gsfc.nasa.gov. From the main site are links to many beautiful images and movies created by the studio. Below is a snapshot from the OSCAR movie created by the NASA Goddard Scientific Visualization Studio.
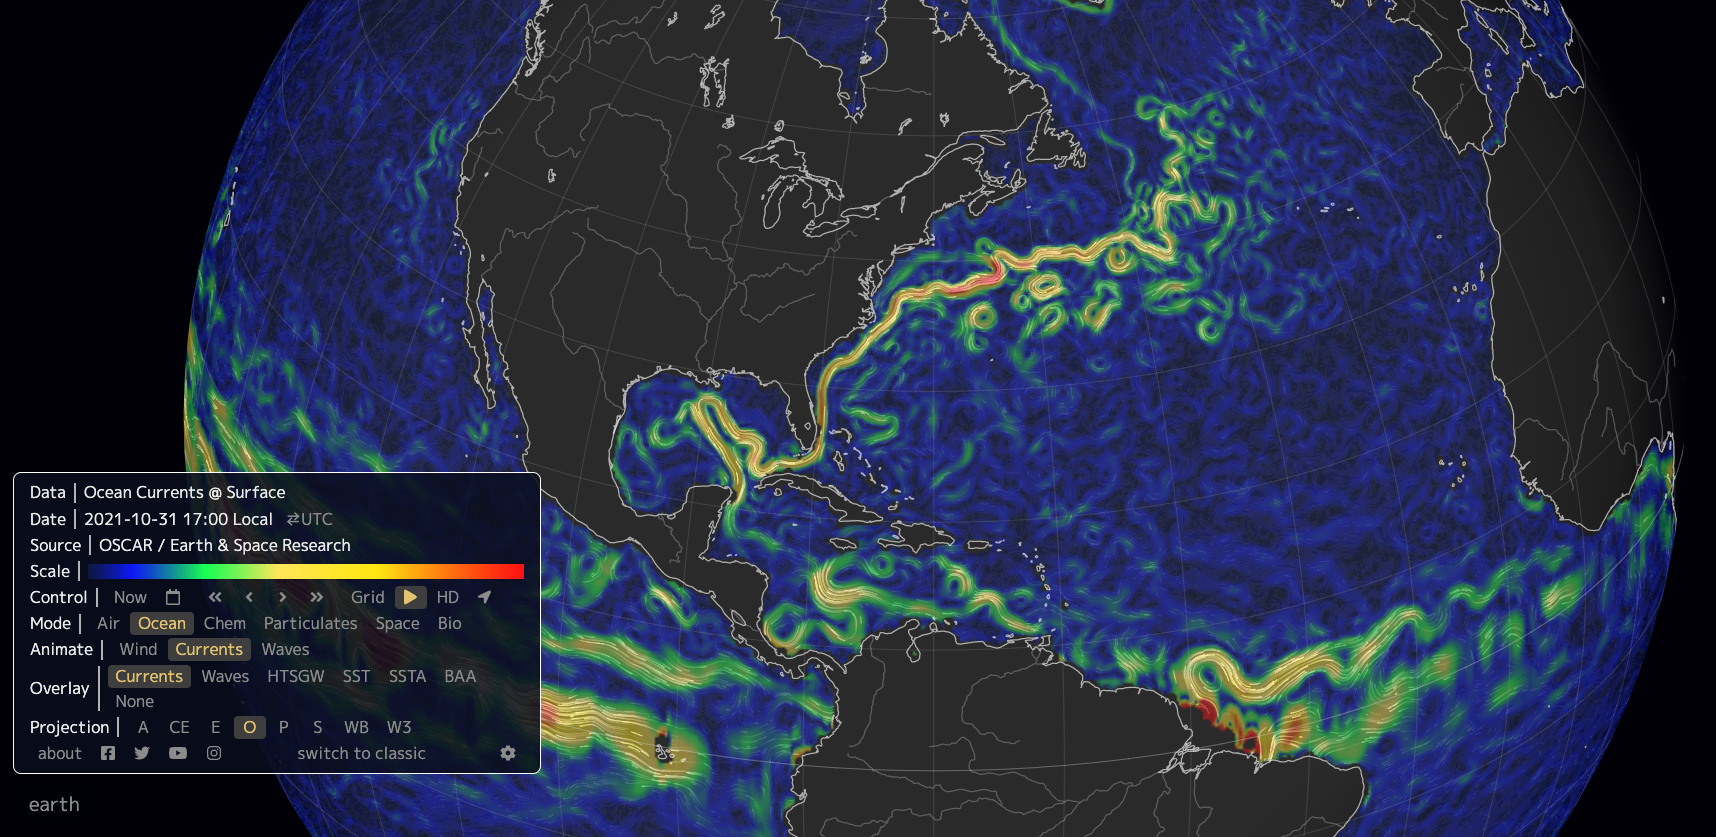
earth.nullschool.net
earth.nullschool.net provides fun visualizations of several global datasets, including OSCAR. Click on “earth” at the bottom left and choose Ocean and Currents to get OSCAR. Clicking on “about” in that menu provides information on the data sources. Below is a screengrab of an earth.nullschool.net animation using OSCAR data for Oct 31, 2021 (at this point in time using OSCAR third degree data).
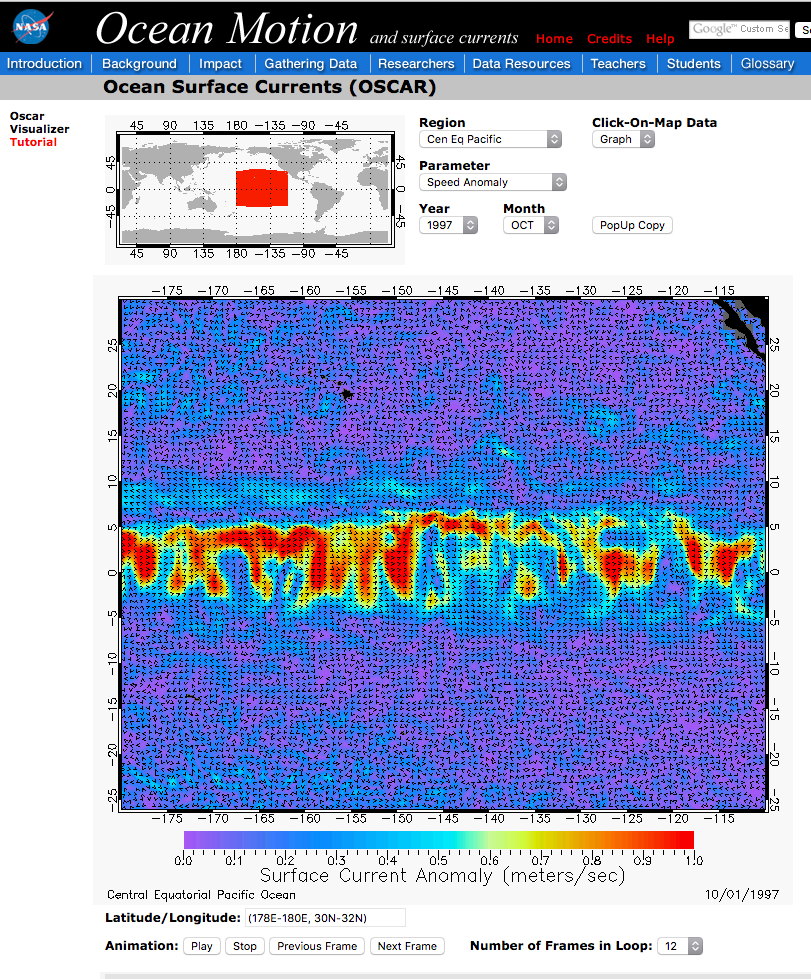
NASA’s OCEAN MOTION website
NASA’s OCEAN MOTION website is a public education resource providing a comprehensive description of the circulation of the oceans. Included in the site are interactive data visualizers, including an OSCAR surface current plotter. The plotter provides OSCAR data up to Mar 2014, but it does allow users to view anomalies for pre-defined areas of the ocean. It also features interviews with scientists, including ESR’s Gary Lagerloef. The site is a valuable resource for both teaching and learning about the circulation of the world’s oceans.